Quantcast
Channel: The Accidental Developer
Viewing all 144 articles
Browse latest View live

Migrating to a new GitHub Enterprise host

$
0
0

I’m moving my VMWare infrastructure from old hardware to new hardware. One of the last guest VMs I’ve waited to move is my GitHub Enterprise (GHE) host. My plan to migrate the system was simple:

  1. Create a new, empty GitHub Enterprise VM on the new VMWare infrastructure
  2. Put the old GHE system in maintenance mode
  3. Take a backup of the old GHE system
  4. Shut down the old GHE system
  5. Start the new GitHub Enterprise VM and select the Migrate option
  6. Restore the backup to the new GHE system using the ghe-restore tool

The installation instructions provided by GitHub are pretty good. To deploy a new GitHub Enterprise image I followed Installing GitHub Enterprise on VMWare.

Of course, no process is perfect. Here are a couple minor points that may save you some time:

When I started the new GitHub Enterprise VM and connected to the console. Once I configured networking, the console provided the next step:

Visit http://192.168.0.123/setup to configure GitHub Enterprise.

However, that didn’t work. It directed me to a blank page at http://192.168.0.123/ssl_warning.html.

The answer? Specify https instead, e.g.:

Visit https://192.168.0.123/setup to configure GitHub Enterprise.

I added the appropriate SSH key from a system where I had the GHE backup and restore tools installed, and then selected the Migration option. It prompted me to run ghe-restore:

$ ./ghe-restore 192.168.0.123
Checking for leaked keys in the backup snapshot that is being restored ...
* No leaked keys found
No ECDSA host key is known for [192.168.0.123]:122 and you have requested strict checking.
Host key verification failed.
Error: ssh connection with '192.168.0.123:122' failed
Note that your SSH key needs to be setup on 192.168.0.123:122 as described in:
* https://enterprise.github.com/help/articles/adding-an-ssh-key-for-shell-access

At first I thought I could just add the key to my known_hosts file:

$ ssh-keyscan -t ecdsa 192.168.0.123

But ssh-keyscan exited with an error code and returned no output.

Eventually I decided to disable StrictHostKeyChecking in my .ssh/config file for the target IP address:

Host 192.168.0.123
	StrictHostKeyChecking no

(Just remember to remove that entry when done! StrictHostKeyChecking is an important security control.)

I should also note that the Running migrations step took forever. I often wondered if it was still working. The first three steps were almost instant, but Running migrations goes on for hours:

  1. Preparing storage device ✔
  2. Updating configuration ✔
  3. Reloading system services ✔
  4. Running migrations
  5. Reloading application services

I tried visiting the regular (i.e. non-admin interface) and it gave me the following message:

Migrating...
Please be patient, this may take a long time. Please do not reboot or shutdown the appliance until this has completed.  
Performing hookshot database migrations.

How long is a long time? What is a hookshot database migration? Who knows, be patient.

The console shows these messages over and over and over:

19:59:04 elasticsearch: Starting Elasticsearch...
19:59:04 elasticsearch: Started Elasticsearch.
19:59:12 elasticsearch: elasticsearch.service: main process exited, code=exited, status=1/FAILURE
19:59:12 elasticsearch: Unit elasticsearch.service entered failed state
19:59:12 elasticsearch.service holdoff time over4, scheduling restart.
19:59:12 cloud-config: Cannot add dependency job for unit could-config.service, ignoring: Unit cloud
19:59:12 elasticsearch: Stopping Elasticsearch...

The reason was that I missed an important step. With the upgrade from 2.13 to 2.14, you need to upgrade the Elasticsearch indices (see Migrating Elasticsearch indices to GitHub Enterprise 2.14 or later).

I started from the beginning again, adding the above Elasticsearch migration step just after putting GHE into maintenance mode. Everything else proceeded smoothly, and in a much more reasonable amount of time.

It would have been nice if the GitHub Enterprise migration software had been able to identify and notify me of this problem instead of going into an infinite loop. An infinite loop that occurs simultaneously with a Please be patient, this may take a long time message. I hope that by including my misstep here, I might save someone else a few minutes — or hours — of frustration.


Setting a static IP, default gateway, and nameservers via PowerShell

$
0
0

I needed to set up a number of Windows server VMs (Windows 2012R2) as a test bed for a vulnerability scanning suite. This would have been fast & easy using AWS EC2 instances (or Azure!), but I decided to use my internal VMWare infrastructure instead.

For CentOS VMs I would typically use one of three things to configure the static IP, gateway, and default nameservers:

  • nmtui (a text user interface to the network manager)
  • the interactive installer
  • a custom kickstart file

How to accomplish the same thing on Windows 2012R2? In particular, I was looking for Powershell commands, since I would be connecting over a web-based console.

The first command I found was Set-NetIPAddress. I combined that with a blog post on Microsoft’s TechNet site with a promising title: One-liner PowerShell to set IP Address, DNS Servers, and Default Gateway:

PS C:\Users\Administrator> Set-NetIPAddress -InterfaceAlias Ethernet0 -AddressFamily IPv4 -IPAddress 192.168.100.2 -PrefixLength 24 -DefaultGateway 192.168.100.1
Set-NetIPAddress : A parameter cannot be found that matches parameter name 'DefaultGateway'.
At line:1 char:104

Counter-intuitive, but you can’t use Set-NetIPAddress for setting an IP address. As the Set-NetIPAddress command documentation states:

The Set-NetIPAddress cmdlet modifies IP address configuration properties of an existing IP address.

To create an IPv4 address or IPv6 address, use the New-NetIPAddress cmdlet.

Unfortunately, that led me to believe that DefaultGateway was a bad parameter in general. That’s not the case, and it works just fine with the New-NetIPAddress cmdlet as demonstrated in the TechNet article (and below):

PS C:\Users\Administrator> New-NetIPAddress -InterfaceAlias Ethernet0 -AddressFamily IPv4 -IPAddress 192.168.100.2 -PrefixLength 24 -DefaultGateway 192.168.100.1

The Microsoft documentation for the New-NetIPAddress cmdlet further describes the -DefaultGateway option and other options.

Of course, I hadn’t figured that out at the time, and so I had to find a different way to set the default gateway. Change Default Gateway with Powershell was a helpful article, although overly convoluted for my needs. I didn’t need a function to wrap around a couple cmdlets. Here’s what I ended up doing:

Get-NetIPAddress -InterfaceIndex 12
Get-NetRoute -InterfaceIndex 12
Remove-NetIPAddress -InterfaceIndex 12
New-NetIPAddress -InterfaceIndex 12 -IPAddress 192.168.100.2 -PrefixLength 24
Remote-NetRoute -InterfaceIndex 12
New-NetRoute -InterfaceIndex 12 -NextHop 192.168.100.1 -DestinationPrefix 0.0.0.0/0
ping 192.168.100.1
ping 216.154.220.53
Get-DnsClientServerAddress -Interface 12
Set-DnsClientServerAddress -Interface 12 -ServerAddresses @("8.8.8.8","8.8.4.4")
ping osric.com

All of the pings succeeded. It worked!

As I learned later, I could have accomplished the same with just the following 2 commands:

New-NetIPAddress -InterfaceAlias Ethernet0 -IPAddress 192.168.100.2 -AddressFamily IPv4 -PrefixLength 24 -DefaultGateway 192.168.100.1
Set-DnsClientServerAddress -Interface 12 -ServerAddresses @("8.8.8.8","8.8.4.4")

You might wonder why I used InterfaceIndex 12 in the prior example. I used Powershell’s tab completion and for some reason it used -InterfaceIndex instead of -InterfaceAlias. Honestly, I’m not sure why and I’m not sure if InterfaceIndex 12 always corresponds to InterfaceAlias Ethernet0 or not. InterfaceAlias Ethernet0 is certainly more human-readable and is what I used when updating the IP address on subsequent cloned VMs:

  • Add new IP address on same interface
  • Remove old IP address on same interface
  • (Reconnect to RDP [Remote Desktop Protocol] on the new address)
  • Default gateway/routes unchanged, since both IP addresses were in the same subnet

Speaking of RDP, one additional task remained: Could I remote into the host? No, at least, not yet. The error message on Microsoft Remote Desktop (on Mac OSX):

Unable to connect to remote PC. Please provide the fully-qualified name or the IP address of the remote PC, and then try again.

Another online tutorial to the rescue: Enable Remote Desktop on Windows Server 2012 R2 via PowerShell. I was glad to find it, since the registry key step below was very foreign to my Linux mindset:

Set-ItemProperty -Path 'HKLM:\System\CurrentControlSet\Control\Terminal Server' -Name 'fDenyTSConnections' -Value 0
Enable-NetFirewallRule -DisplayGroup 'Remote Desktop'

One last thing I had to do in my Microsoft Remote Desktop client: specify the port:

192.168.100.2:3389

(Even though 3389 is the default RDP port, for some reason it needed that.)

Creating a histogram with Gnuplot

$
0
0

Gnuplot has plenty of examples on its histograms demo page. The demos use immigration.dat as a datasource, which you can find in gnuplot’s GitHub repository: immigration.dat data source.

While the examples demonstrate many of the available features, it’s not clear what some of the specific options do. You could read the documentation, but who has time for that? Some of us are just trying to create really simple histograms and don’t need to master the nuances of gnuplot.

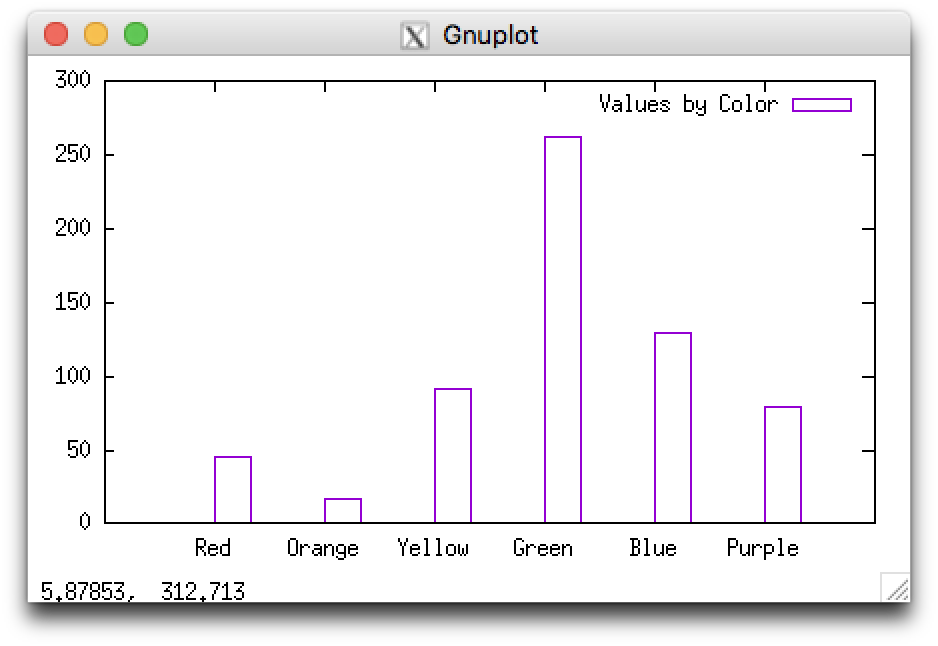
Here’s my sample data, colors.data, a series of attributes and a value associates with each attribute:

#Color Count
Red 45
Orange 17
Yellow 92
Green 262
Blue 129
Purple 80

Start gnuplot:

$ gnuplot

Set the style to histograms and plot the datafile:

gnuplot> set style data histograms
gnuplot> plot './colors.data' using 2:xtic(1)

The plot command above indicates that were are plotting the data from column 2, and we are using column 1 for the xtic labels (the x-axis item markers).

In the resulting histogram, the title says 'color.data' using using 2:xtic(1) which is not particularly meaningful. You can change this by including a title:

gnuplot> plot 'colors.data' using 2:xtic(1) title 'Values by Color'

That’s it! Here’s the result:

An example histogram displaying several vertical bars of different heights. In this example, the bars are hollow, defined by a purple outline.

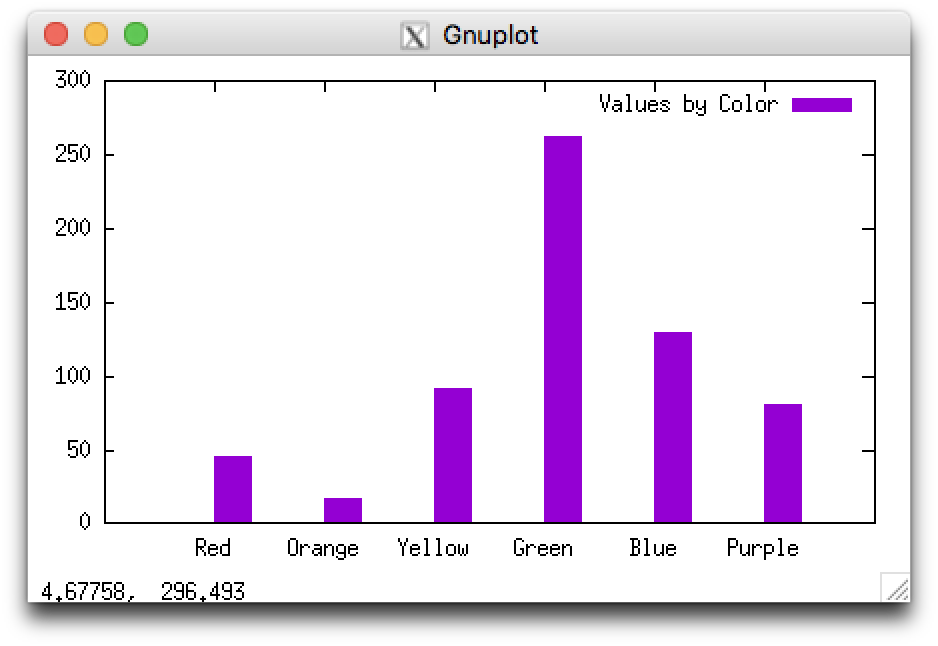
I admit, the hollow bars were bothering me, so I make them solid:

gnuplot> set style fill solid

An example histogram showing several vertical bars of different heights. The bars are solid purple in this example.

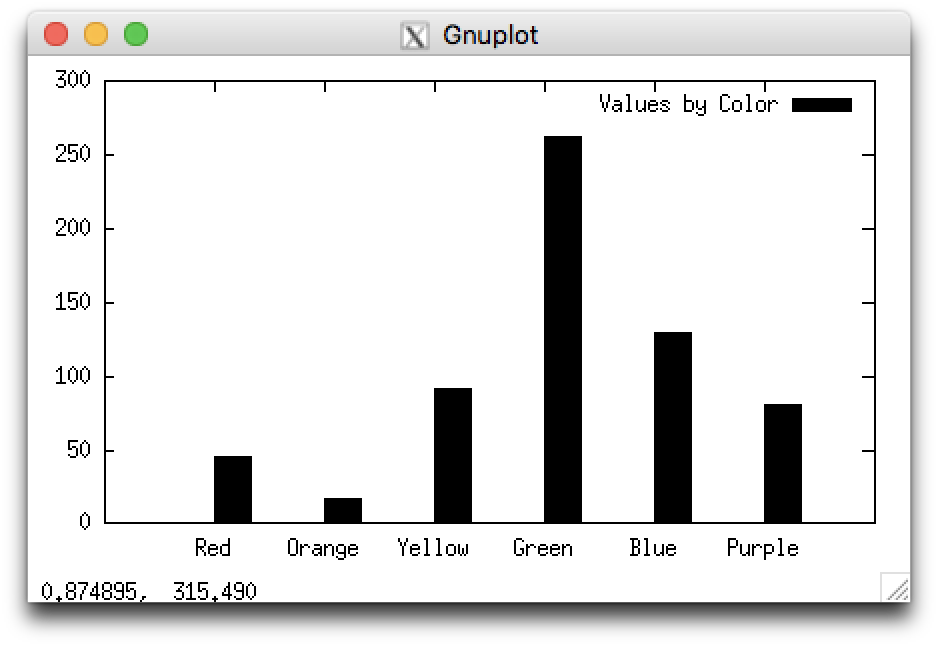
The purple color looked great, but if you’re planning to print something in black-and-white you might want to change the color as well:

gnuplot> plot './colors.data' using 2:xtic(1) linecolor 'black' title 'Values by Color'

An example histogram showing several vertical bars of different heights. In this example, the bars are solid black.

ESXi upgrade from 5.5 to 6.7

$
0
0

ESXi 5.5 recently reached end-of-support (see End of General Support for vSphere 5.5), but my sales rep informed me that I was eligible for a free upgrade. Great! I set about doing just that.

First of all, I should note that you can’t upgrade directly from 5.5 to 6.7, so I upgraded to 6.5 first. I ran into several missteps along the way, which I have documented here:

Short version: use Rufus on Windows to build your bootable installation USB flash drive! Even if you are not a Windows user, find a Windows machine or download a Windows VM and use Rufus to build your boot media. Seriously, use Rufus and skip to the end of this article for a couple extra tips.

I found a succinct article, Create an ESXi 6.5 installation USB under two minutes, but the steps listed there expect you to use a Windows application to build the USB media. I was using MacOS, so I went looking for the MacOS alternative and found How to create a bootable VMware ESXi USB drive on Macs.

After following the steps there, I plugged the USB flash drive into my server, used the BIOS boot menu to boot from the USB drive, and got the following error:

Booting from Hard drive C:

Non-system disk
Press any key to reboot

I had run into a non-fatal error when using fdisk, maybe that had something to do with it? The error message was:

fdisk: could not open MBR file /usr/standalone/i386/boot0: No such file or directory

I also read that copying the files from the ISO to the USB using cp was not recommended, so I tried using dd as well:

$ sudo dd if=~/Downloads/VMware-VMvisor-Installer-6.7.0.update01-10302608.x86_64.iso of=/dev/rdisk2 bs=1m

After that, I got a different error message when trying to boot from the USB drive:

No boot device available or operating system detected.
Current boot mode is set to BIOS.
Please ensure a compatible bootable media is available.

Next I tried VMWare’s own documentation: Format a USB Flash Drive to Boot the ESXi Installation or Upgrade

This method required a Linux host with syslinux installed. I had a CentOS 7.5 host available, and installed syslinux 4.05 via yum:

$ sudo yum install syslinux

When I booted from the USB drive, I got the following error message:

menu.c32: not a COM32R image
boot:

I searched for that error and found the post Cannot boot from USB disk with “not a COM32R image” error on AskUbuntu, so I tried that:

[tab] install hddimage
boot: install

Same error.

The error mentioned menu.c32 specifically, so I copied /usr/share/syslinux/menu.c32 and /usr/share/syslinux/mboot.c32 to the USB key, overwriting the version from the VMWare ISO image. (There was also a safeboot.c32 on the USB key, but no corresponding file in /usr/share/syslinux.)

This time booting from the USB drive got slightly farther:

ESXi-6.7.0-201819929910 standard installer
Boot from local disk

Press (Tab) to edit options
Automatic boot in 1 second...

Loading -c...failed!
No files found!
boot:

I also tried keeping the mboot.c32 file from the VMWare ISO and replacing just the menu.c32 file, but that did not help.

I found some suggestions that VMWare is very picky about the version of syslinux that is used, so I also compiled a newer version of syslinux, 6.02, which is specifically mentioned in the VMWare documentation I was following (“For example, if you downloaded Syslinux 6.02, run the following commands”). That didn’t help either.

I raised a cry for help on the VMWare community forums, and someone chimed in right away and advised me to give up on Linux just use Rufus on Windows. I fired up a Windows 2012r2 VM — if you don’t have one, you can download an ISO from the Microsoft Evaluation Center and install one — and downloaded and installed Rufus. (Rufus looks a little sketchy, but is vouched for by many sane and security-minded people.)

In just a couple minutes, I had working boot media installed on my USB flash drive!

I booted my VMWare host and got a new error during the upgrade process:

Error(s)/Warning(s) Found During System Scan

The system encountered the following error(s).

Error(s)

<CONFLICTING_VIBS ERROR: Vibs on the host are conflicting with vibs in metadata. Remove the conflicting vibs or use Image Builder to create a custom ISO providing newer versions of the conflicting vibs.  ['LSI_bootbank_scsi-mpt3sas_04.00.00l00.lvmw-1OEM.500.0.0.472560', 'LSI_bootbank_scsi-mpt3sas_04.00.00l00.lvmw-1OEM.500.0.0.472560']>

Use the arrow keys to scroll

(F9) Back (F11) Reboot

A Reddit post, Trying to remove VIB, pointed out that the driver referenced by the VIB (vSphere Installation Bundle) is for hardware that isn’t compatible with my Dell hardware, so I would be safe to remove it. I removed it using the ESX command-line interface:

# esxcli software vib remove -n=scsi-mpt3sas

After that I was able to boot the system from the USB drive and upgrade the ESXi installation to 6.5.

A few additional notes:

  • On my hardware, the ESXi OS was installed on an embedded SD card. The menu asked me to select upon which drive I wanted to install or upgrade ESXi, so I chose the smallest partition that corresponded to the embedded SD card. Your experience may differ.
  • I was able to upgrade the 6.5 installation to 6.7 entirely from the web-based VMWare Update Manager.
  • I was able to upgrade the license on My VMWare (see How to upgrade license keys in My VMware).

Icinga2 role permissions, filters

$
0
0

I have Icinga2 and Icingaweb2 set up for monitoring hosts and services for myself, but I wanted to expand on my current configuration and let web developers manage monitoring for their assets (development and staging hosts and web servers).

webdev is the name of one of my host groups, defined in my /etc/icinga2/conf.d/groups.conf file:

object HostGroup "webdev" {
  display_name = "Web Development Hosts"
}

The hosts I want developers to be able to monitor are members of the webdev host group.

First I created a new role in the web interface under Configuration — Authentication — Roles:

Role Name:
webdev
Groups:
webdev [this is the name of a group on my LDAP server]
Permission Set:
Allow everything (*)
monitoring/filter/objects:
“webdev”

This created the role without any errors. However, when I logged in as a member of the webdev group, I received the following error message:

Service Problems
Cannot apply restriction monitoring/filter/objects using the filter webdev. You can only use the following columns: instance_name, host_name, hostgroup_name, service_description, servicegroup_name, _(host|service)_<customvar-name>

I needed to specify a key-value pair for the monitoring/filter/objects:

hostgroup_name=webdev

You can include multiple host groups by including a logical OR:

(hostgroup_name=webdev||hostgroup_name=webprod)

Once I confirmed that worked, I further restricted the Permission Set to a more limited set of options:

  • Allow access to module monitoring (module/monitoring)
  • Allow all commands (monitoring/command/*)

A user in the webdev role now has access to everything I expected except contacts (Overview — Contacts). The Contacts page produces a long and unfriendly error message that begins with:

SQLSTATE[42S22]: Column not found: 1054 Unknown column 'ho.object_id' in 'on clause'

That’s a known bug, and currently an issue filed on the icingaweb2 GitHub repository: Non-admin overview Contact gives SQL error

ipactl error: Failed to start Directory Service: Command ‘/bin/systemctl start dirsrv@FREEIPA-OSRIC-NET.service’ returned non-zero exit status 1

$
0
0

Earlier today I got an alert that the LDAP service on my FreeIPA server was down. This was not long after I had received another alert that the drive space on the /var partition was critical. I logged on, freed up some drive space, and tried to start the service:

$ sudo ipactl start
Starting Directory Service
Failed to start Directory Service: Command '/bin/systemctl start dirsrv@FREEIPA-OSRIC-NET.service' returned non-zero exit status 1

I tried running systemctl directly to see the error message:

$ sudo systemctl start dirsrv@FREEIPA-OSRIC-NET.service

It produced an error again, as expected, so I examined the status message:

$ systemctl -l status dirsrv@FREEIPA-OSRIC-NET.service
● dirsrv@FREEIPA-OSRIC-NET.service - 389 Directory Server FREEIPA-OSRIC-NET.
   Loaded: loaded (/usr/lib/systemd/system/dirsrv@.service; disabled; vendor preset: disabled)
   Active: failed (Result: exit-code) since Tue 2018-10-30 10:41:41 CDT; 27s ago
  Process: 23515 ExecStart=/usr/sbin/ns-slapd -D /etc/dirsrv/slapd-%i -i /var/run/dirsrv/slapd-%i.pid (code=exited, status=1/FAILURE)
  Process: 23510 ExecStartPre=/usr/sbin/ds_systemd_ask_password_acl /etc/dirsrv/slapd-%i/dse.ldif (code=exited, status=0/SUCCESS)
 Main PID: 23515 (code=exited, status=1/FAILURE)

Oct 30 10:41:41 freeipa.osric.net ns-slapd[23515]: [30/Oct/2018:10:41:41.555157141 -0500] - ERR - plugin_dependency_startall - object plugin Roles Plugin is not started
Oct 30 10:41:41 freeipa.osric.net ns-slapd[23515]: [30/Oct/2018:10:41:41.556541498 -0500] - ERR - plugin_dependency_startall - preoperation plugin sudorule name uniqueness is not started
Oct 30 10:41:41 freeipa.osric.net ns-slapd[23515]: [30/Oct/2018:10:41:41.557822184 -0500] - ERR - plugin_dependency_startall - preoperation plugin uid uniqueness is not started
Oct 30 10:41:41 freeipa.osric.net ns-slapd[23515]: [30/Oct/2018:10:41:41.559024594 -0500] - ERR - plugin_dependency_startall - object plugin USN is not started
Oct 30 10:41:41 freeipa.osric.net ns-slapd[23515]: [30/Oct/2018:10:41:41.560834787 -0500] - ERR - plugin_dependency_startall - object plugin Views is not started
Oct 30 10:41:41 freeipa.osric.net ns-slapd[23515]: [30/Oct/2018:10:41:41.564809195 -0500] - ERR - plugin_dependency_startall - extendedop plugin whoami is not started
Oct 30 10:41:41 freeipa.osric.net systemd[1]: dirsrv@FREEIPA-OSRIC-NET.service: main process exited, code=exited, status=1/FAILURE
Oct 30 10:41:41 freeipa.osric.net systemd[1]: Failed to start 389 Directory Server FREEIPA-OSRIC-NET..
Oct 30 10:41:41 freeipa.osric.net systemd[1]: Unit dirsrv@FREEIPA-OSRIC-NET.service entered failed state.
Oct 30 10:41:41 freeipa.osric.net systemd[1]: dirsrv@FREEIPA-OSRIC-NET.service failed.

Several dependencies the directory server expects to find aren’t running! I assumed they crashed when the drive ran out of space, so I tried rebooting.

Once the system restarted, I confirmed that the directory server and other FreeIPA services started as expected:

$ sudo ipactl status
Directory Service: RUNNING
krb5kdc Service: RUNNING
kadmin Service: RUNNING
httpd Service: RUNNING
ipa-custodia Service: RUNNING
ntpd Service: RUNNING
pki-tomcatd Service: RUNNING
ipa-otpd Service: RUNNING
ipa: INFO: The ipactl command was successful

That fixed it! Sometimes the most basic troubleshooting steps are enough.

Integrating FreeIPA authentication with GitHub Enterprise

$
0
0

The GitHub Enterprise – Using LDAP documentation lists FreeIPA as a supported LDAP service.

Although I was able to successfully test a basic LDAP connection, the test failed after I specified the Email (using value “mail”) and SSH key (using value “ipaSshPubKey”) fields. I received the following error:

Field `mail` is not an attribute in the user entry.
Field `ipaSshPubKey` is not an attribute in the user entry.

For the Domain base, I had specified the following (which had worked for integrating FreeIPA’s LDAP with other services):

dc=freeipa,dc=osric,dc=net

The problem, as far as I can tell, is that searching dc=freeipa,dc=osric,dc=net for a username returns multiple entries.

The first entry, from cn=users,cn=compat,dc=freeipa,dc=osric,dc=net, contains just 9 attributes and does not include mail or ipaSshPubKey.

The second entry, from cn=users,cn=accounts,dc=freeipa,dc=osric,dc=net contains 34 attributes and includes mail and ipaSshPubKey.

I changed the value of Domain base to:

cn=accounts,dc=freeipa,dc=osric,dc=net

This solved the problem for me.

Icinga2 and PagerDuty integration

$
0
0

E-mail is not a good way to get my attention in a timely fashion. E-mail is inherently asynchronous, and healthy minds may ignore it for hours or even days at a time. So how do I handle monitoring alerts? One way is by using PagerDuty, a service that can call, text, or send push notifications to you (among other features).

I followed the steps at PagerDuty’s Icinga2 Integration Guide, but no alerts were coming through. What went wrong?

I checked the Icinga2 log file for messages containing pagerduty. On most systems:

grep -i pagerduty /var/log/icinga2/icinga2.log

It looked like a permissions issue:

[2018-09-07 16:50:20 -0500] warning/PluginNotificationTask: Notification command for object 'stephano' (PID: 11482, arguments: '/usr/local/bin/pagerduty_icinga.pl' 'enqueue' '-f' 'pd_nagios_object=host') terminated with exit code 128, output: execvpe(/usr/local/bin/pagerduty_icinga.pl flush) failed: Permission denied

What was going on?

I should note that I did not follow the instructions in the integration guide exactly. For example, I did not add the crontab entry to the icinga user’s crontab. I instead added the following to /etc/cron.d/pagerduty:

* * * * * icinga /usr/local/bin/pagerduty_icinga.pl flush

That should accomplish the thing, though.

Also, I made the permissions on /usr/local/bin/pagerduty_icinga.pl fairly restrictive, but the icinga user still had permission to read and execute the script:

$ ls -l /usr/local/bin/pagerduty_icinga.pl
-rwxr-x---. 1 root icinga 9144 Sep  7 16:18 /usr/local/bin/pagerduty_icinga.pl

Then I remembered to check SELinux:

$ sudo ausearch -f pagerduty_icinga.pl
type=AVC msg=audit(1541712215.916:326539): avc:  denied  { ioctl } for  pid=20609 comm="perl" path="/usr/local/bin/pagerduty_icinga.pl" dev="dm-2" ino=5529476 scontext=system_u:system_r:icinga2_t:s0 tcontext=unconfined_u:object_r:user_home_t:s0 tclass=file

Sure enough, all of the other files in that directory had the context bin_t, but pagerduty_icinga.pl still had the SELinux type context from my home directory:

$ ls -lZ /usr/local/bin/pagerduty_icinga.pl
-rwxr-x---. root icinga unconfined_u:object_r:user_home_t:s0   /usr/local/bin/pagerduty_icinga.pl

I set the appropriate type context and ran restorecon:

$ sudo semanage fcontext -a -t bin_t /usr/local/bin/pagerduty_icinga.pl
$ sudo restorecon -v /usr/local/bin/pagerduty_icinga.pl
$ ls -lZ /usr/local/bin/pagerduty_icinga.pl
-rwxr-x---. root icinga unconfined_u:object_r:bin_t:s0   /usr/local/bin/pagerduty_icinga.pl

After that change, the PagerDuty integration worked!

The entire issue stemmed from the difference between copying [cp] the file (as specified in the integration guide) and moving [mv] the file. I figured there was no point in leaving a stray copy of the script in my home directory, so I simply moved the file:

$ sudo mv pagerduty_icinga.pl /usr/local/bin/

A copy of the file would have inherited the SELinux context of the parent directory (bin_t), but moving the file preserved the SELinux context.

As it turns out, mv includes an option to update the SELinux file context, which would have solved my problem:

-Z, --context
              set SELinux security context of destination file to default type

I have some additional thoughts about the differences between moving and copying files, but those will have to wait for another day.


Identifying DGA domains using Scrabble scores: a naive approach

$
0
0

I had the idea of applying Scrabble scores to DGA domains over the summer of 2018, but the idea was rekindled when I saw Marcus Ranum‘s keynote at BroCon 2018. He talked about the advantages of scoring systems: they are fast, they are simple, and they can be surprisingly effective.

Domain Generating Algorithms (DGAs)

Malware uses DGAs to generate hundreds or thousands of new domain names daily. The malware then attempts to contact some or all of the domains. If a successful attempt is made to a control server, the malware will receive new instructions for malicious activity. The people and systems managing the malware need only register one new domain a day, but a defender would have to anticipate and/or discover thousands a day. To read more about DGAs, I recommend these articles from Akamai:

Scrabble Scores and DGAs

I’ve noticed that some, not all Domain Generating Algorithms produce unreadable domains like:

rjklaflzzdglveziblyvvcyk.com

It doesn’t look like a normal domain name, but is there a way a computer can reliably differentiate between that and a normal domain name? I noted that it’s loaded with high-value Scrabble letters like z, y, and k. I calculated the Scrabble score of the domain, assigning a score of 1 to all non-alphabetic characters (in this case, the dot).

That above domain, including the dot-com TLD, has a length of 28, a Scrabble score of 101, and an average Scrabble score per letter of 3.7. I hypothesized that normal domain names would have lower average per-letter scores.

When I introduced my plan to a colleague, he called it poor man’s entropy. Which it is! But it is also very fast and can be (presumably) calculated at line speed.

The Experiment

I took the Majestic Million — the top one million sites on the web — as my control group, and a list of 969 DGA domains harvested from @DGAFeedAlerts as my experimental group. Keep in mind that the Majestic Million still contains sites like michael-kors-handbags.com: highly questionable sites, but that are probably not generated by an algorithm.

I created and ran a script (available at https://github.com/cherdt/scrabble-score-domain-name) on the domains from both groups, calculating the length (total number of characters), the Scrabble score (assigning 1 to non-alpha characters), and the average Scrabble score per letter (Scrabble score/Length) for each domain.

Average Scrabble Score Per Letter

I initially thought the average Scrabble score per letter would be a superior measure. I didn’t want to penalize lengthy domain names. After all, I once registered, on behalf of a friend, the domain name theheadofjohnthebaptistonaplate.com. It’s ridiculously long and has a total score of 68, but an average per letter score of just 2.0.

It quickly became apparent that this is not a useful measure. Here are 3 short, legitimate domains that have high average per letter scores:

  • qq.com (a popular messaging platform in China) has an average per letter score of 5.4
  • xbox.com (the gaming console) has an average per letter score of 3.9
  • xkcd.com (a popular web comic) has an average per letter score of 3.6
Histogram showing the relative frequencies of DGA and Majestic Million domains by average Scrabble score per character.

The goal of any such calculation would be not just to identify DGA domains, but to investigate or block them. qq.com is, according to the Majestic Million as of 20 November 2018, the 49th most popular domain on the Internet. Blocking or manually investigating domains based on high average scores alone would not be advisable.

Both of those domain names are very short though. What about some combination of average per letter score and length, such as the total Scrabble score?

Total Scrabble Score
The highest total Scrabble score in the Majestic Million is xxxxxxxxxxxxxxxxxxxxxxxxxxxxxxxxxxxxxxxxxxxx.com, with a score of 359. This is higher than the highest score on my DGA domain list: pibcjbpzdqzhvklfkbrsfuhyayfy.biz, with a score of 125. It’s still possible that a legitimate, although unusual, domain name could exceed the DGA domain scores.

Histogram showing the relative frequencies of DGA and Majestic Million domains by Scrabble score.

From the above graph, it looks like a Scrabble score of 75 or above is indicative of a DGA domain, right? Well, yes and no: recall that the sample size of DGA domains is 969, compared to the Majestic Million. Taking into account only domains with Scrabble scores of 75 or above:

  • 1045 Majestic Million domains (about 0.1%)
  • 56 DGA domains (about 5.8%)

If a 0.1% false positive rate and a 5.8% true positive rate are acceptable, then this is potentially actionable information. I suspect that in some environments, such as corporate networks, that might be acceptable. You might block a few legitimate sites, like highperformancewindowfilmsbrisbane.com.au, but on the whole that might be worth it to block malicious Command & Control (sometimes referred to as C2, CnC, or C&C) domains.

Variance in Command & Control DGA Domains
The 969 DGA domains I analyzed are related to 21 different C2 sources, and not all of them look the same. The first example I used, rjklaflzzdglveziblyvvcyk.com, is a Qakbot domain. Suppobox, on the other hand, combines 2 random words to create domains such as:

  • callfind.net
  • desireddifferent.net
  • eveningpower.net

Not only do the Suppobox domains have low Scrabble scores, they aren’t even obviously unusual to a human observer. Automatically detecting Suppobox domains would be difficult. On the other hand, eliminating Suppobox and similar algorithms from the sample may make identifying other DGA domains easier.

I selected 5 C2 DGAs that appeared to have high-entropy domain names: Bedep, Murofet, Necurs, P2pgoz, and Qakbot. This subset included 244 DGA domains:

  • 34 Bedep domains
  • 14 Murofet domains
  • 176 Necurs domains
  • 14 P2pgoz domains
  • 6 Qakbot domains
Histogram showing the relative frequencies of high-entropy DGA and Majestic Million domains by Scrabble score.

If we keep the Scrabble score threshold at 75, the number of false positives will remain the same: 1045. However, the number of true positives is 51. For the 5 selected DGAs, the true positive rate is now, or 21%. Still far from perfect, but potentially worth trying.

Further Discussion

It is likely that any such naive approach will become less and less effective as malware, such as Suppobox, uses DGAs that are more difficult to detect.

While analyzing these data, I had several ideas for less naive approaches and additional analyses, including machine learning techniques (binary logistic regression, principal components analysis), but I will save that exploration for a future post.

Kitchen CI – using the Vagrant driver

$
0
0

I’d previously been using the Docker driver with Kitchen CI and kitchen-ansible to test my Ansible playbooks. I really like using Kitchen CI. Test-driven infrastructure development! Regression testing! It’s great.

There were several reasons I decided to switch from the Docker driver to Vagrant. My target hosts are all either VMs or bare metal servers, so Vagrant VMs more closely resemble that environment. In particular, there are a couple areas where Docker containers don’t perform well for this purpose:

  • Configuring and testing SELinux settings
  • Configuring and testing systemd services

Using Vagrant instead is easy enough, just change the driver name in the .kitchen.yml file from:

---
driver:
name: docker

to:

---
driver:
name: vagrant

I also updated the platforms section from:

platforms:
- name: centos-7
  driver_config:
    image: centos7-ansible

to:

platforms:
- name: centos-7

Then I ran kitchen test all:

-----> Starting Kitchen (v1.20.0)
>>>>>> ------Exception-------
>>>>>> Class: Kitchen::ClientError
>>>>>> Message: Could not load the 'vagrant' driver from the load path. Please ensure that your driver is installed as a gem or included in your Gemfile if using Bundler.
>>>>>> ----------------------
>>>>>> Please see .kitchen/logs/kitchen.log for more details
>>>>>> Also try running `kitchen diagnose --all` for configuration

Sanity check, do I have Vagrant installed?

$ vagrant --version
Vagrant 2.0.3

I should note that I spent a while trying to test this on a CentOS VM running in VirtualBox. Installing VirtualBox and Vagrant on CentOS can be a bit of a pain. VirtualBox networking within a VirtualBox VM doesn’t work very well, if at all. I ended up running this on my Mac laptop.

Install the kitchen-vagrant gem:

$ gem install kitchen-vagrant
Fetching: kitchen-vagrant-1.3.2.gem (100%)
ERROR:  While executing gem ... (Gem::FilePermissionError)
You don't have write permissions for the /Library/Ruby/Gems/2.3.0 directory.

Oh, right. User privileges:

$ sudo gem install kitchen-vagrant
Fetching: kitchen-vagrant-1.3.2.gem (100%)
Successfully installed kitchen-vagrant-1.3.2
Parsing documentation for kitchen-vagrant-1.3.2
Installing ri documentation for kitchen-vagrant-1.3.2
Done installing documentation for kitchen-vagrant after 0 seconds
1 gem installed
$ kitchen test all

Since this is the first time I ran it (successfully) with Vagrant, it had to download OS images for CentOS 7. It took a little while, but now it’s done and subsequent tests run a bit faster.

Running a Python Flask application in a Docker container

$
0
0

I’ve played with Docker containers but haven’t really done anything, useful or otherwise, with them. I decided to create a Docker image that includes a web-based chatbot. You can find the Git repository for this (including the finished Dockerfile) at https://github.com/cherdt/docker-nltk-chatbot

I’ve worked with this particular chatbot before, which is based on the nltk.chat.eliza module. I turned it into a web application by wrapping it in a Flask app. And because Flask warns you not to run Flask directly in production, I call the Flask app via uWSGI.

I started by creating a Dockerfile:

# mkdir chatbot
# cd chatbot
# vi Dockerfile

I needed to start with a base image, so I picked CentOS 7:

FROM centos:centos7

I knew I would need several packages installed to satisfy the dependencies for Flask and uWSGI (although it took me a couple tries before I determined that I would need gcc and python-devel in order to install uWSGI):

RUN /usr/bin/yum --assumeyes install epel-release gcc
RUN /usr/bin/yum --assumeyes install python python-devel python-pip

Then to install Flask and dependencies, uWSGI, and the Python NLTK (Natural Language ToolKit):

RUN /usr/bin/pip install Flask flask-cors nltk requests uwsgi

The Python file for the Flask app and the HTML template file needed to be copied into the container:

COPY chatbot.py ./
COPY chat.html ./

Finally, the command that will run uWSGI and point it at the Flask app:

CMD ["/usr/bin/uwsgi", "--http", ":9500", "--manage-script-name", "--mount", "/=chatbot:app"]

Note that CMD does not like spaces: each item needs to be a separate array element.

Now to build the image:

# docker build --tag chatbot .
...[some other output]...
Successfully built ab3a32938f0e
Successfully tagged chatbot:latest

# docker images
REPOSITORY          TAG                 IMAGE ID            CREATED              SIZE
chatbot             latest              ab3a32938f0e        5 seconds ago        486MB

To run a container based on this image, I wanted to do several things:

  • Run the process in the background (detached mode), using -d
  • Restart the Docker container on errors, using --restart on-failure
  • Map port 80 on the host to 9500 (the listening port of uWSGI in the container) using -p 80:9500
# docker run -d --restart on-failure -p 80:9500 chatbot

Now, to test the application:

# curl localhost/chat-api?text=Does+this+work%3F
Please consider whether you can answer your own question.

Success!!!

Deploying to Production (or at least somewhere else)

Now that I had a working container, I wanted to deploy it somewhere other than my development environment. I created logged into the Docker Hub website and create a repository at cherdt/nltk-chatbot.

To store the image, first I needed to log in:

# docker login
Login with your Docker ID to push and pull images from Docker Hub. If you don't have a Docker ID, head over to https://hub.docker.com to create one.
Username: cherdt
Password:
WARNING! Your password will be stored unencrypted in /root/.docker/config.json.
Configure a credential helper to remove this warning. See
https://docs.docker.com/engine/reference/commandline/login/#credentials-store

Login Succeeded

Then I needed to tag my image with the repository name:

# docker tag ab3a32938f0e cherdt/nltk-chatbot

Then I was able to push the image to the repository:

# docker push cherdt/nltk-chatbot

I don’t have a production server where I want to run this, but as a proof-of-concept for myself I wanted to deploy it somewhere. I created another CentOS 7 virtual machine and installed Docker there (see Get Docker CE for CentOS).

I pulled the image onto the new host. This did not require logging in, since it is a public repository:

# docker pull cherdt/nltk-chatbot

I ran a container the same way I had before, but updating the image name to match the repository:

# docker run -d --restart on-failure -p 80:9500 cherdt/nltk-chatbot

And the test?

# curl localhost/chat-api?text=Does+this+work%3F
Please consider whether you can answer your own question.

Considerations

The deployment host needed to have Docker installed and the Docker daemon running, but none of the other dependencies were needed: gcc, python-devel, pip, Flask, uwsgi, etc. are all self-contained in the Docker image.

On the other hand, the Docker image is just shy of 500 MB:

# docker images
REPOSITORY            TAG                 IMAGE ID            CREATED             SIZE
cherdt/nltk-chatbot   latest              ab3a32938f0e        28 minutes ago      486MB

That’s pretty heavy considering the chatbot.py file is 369 bytes! For a trivial proof-of-concept application that seems like a lot of overhead, but if this was a critical production application, or even if it’s something I planned to deploy several times, the amount of time saved in setting up and configuring new hosts would be worth it. It also means that the behavior of the application in my development environment should be the same as the behavior in the production environment.

Docker versus Podman and iptables

$
0
0

I have recently been learning about podman, a tool for running containers that has a command syntax that matches Docker, but that does not require a Docker daemon and which does not require root privileges.

I ran into some unexpected problems publishing ports with Podman, which had to do with my default DROP policy on the iptables FORWARD chain. Below I will demonstrate some of the differences between Docker and Podman in terms of iptables changes, and provide a workaround for Podman.

To test the differences, I used Amazon AWS EC2 t2.nano instances based on the CentOS 7 (x86_64) – with Updates HVM AMI. In my test I am going to run a mock HTTP server using netcat, so I opened port 8080 to the world in the AWS security group for these EC2 instances.

Docker

After launching the EC2 instance, I ran through the following steps to configure the host:

  • sudo yum update
  • sudo reboot
  • Follow steps to install Docker on CentOS:
    • sudo yum-config-manager --add-repo https://download.docker.com/linux/centos/docker-ce.repo
    • sudo yum install docker-ce
  • sudo yum install iptables-service

Change the FORWARD chain policy to DROP in /etc/sysconfig/iptables:

:FORWARD DROP [0:0]

Restart iptables:

sudo systemctl restart iptables

I tried running a simple container:

sudo docker run --rm -it --public 8080:80 alpine sh
docker: Cannot connect to the Docker daemon at unix:///var/run/docker.sock. Is the docker daemon running?.
See 'docker run --help'.

Oh right, the Docker daemon needed to be running:

sudo systemctl start docker

I ran the simple container again, this time successfully:

sudo docker run --rm -it --public 8080:80 alpine sh

From inside the container, I started netcat listening on port 80:

# nc -l -p 80

I was then able to connect to the container from the outside world, e.g. my desktop, like so:

curl 3.85.222.191:8080

I saw the request header appear via netcat within the container:

GET / HTTP/1.1
Host: 3.85.222.191:8080
User-Agent: curl/7.56.1
Accept: */*

From there I entered:

Hello, world
[^d]

And confirmed that the response text was received by curl. The entire communication was successful.

Docker sets up some routes so that traffic to a container IP address is handled by the docker0 interface:

$ route
Kernel IP routing table
Destination     Gateway         Genmask         Flags Metric Ref    Use Iface
default         ip-172-31-80-1. 0.0.0.0         UG    0      0        0 eth0
172.17.0.0      0.0.0.0         255.255.0.0     U     0      0        0 docker0
172.31.80.0     0.0.0.0         255.255.240.0   U     0      0        0 eth0

Docker makes a lot of changes to iptables rules, most of which are filter rules (there are a couple tweaks to NAT rules, which have ignored for now). Primarily I want to focus on the filter rules in the FORWARD chain, since that chain directly affects packets coming in on the eth0 interface that are destined for the docker0 interface.

$ sudo iptables -v -L FORWARD
Chain FORWARD (policy DROP 0 packets, 0 bytes)
 pkts bytes target     prot opt in     out     source               destination 
   39  2093 DOCKER-USER  all  --  any    any     anywhere             anywhere  
   39  2093 DOCKER-ISOLATION-STAGE-1  all  --  any    any     anywhere             anywhere
    7   621 ACCEPT     all  --  any    docker0  anywhere             anywhere             ctstate RELATED,ESTABLISHED
   13   660 DOCKER     all  --  any    docker0  anywhere             anywhere   
   19   812 ACCEPT     all  --  docker0 !docker0  anywhere             anywhere 
    0     0 ACCEPT     all  --  docker0 docker0  anywhere             anywhere  
    0     0 REJECT     all  --  any    any     anywhere             anywhere             reject-with icmp-host-prohibited

Let’s look at what each rule is doing:

  1. All forwarded packets are sent to the DOCKER-USER chain. In this case, the DOCKER-USER chain RETURNs all packets, and so are further processed by the other FORWARD chain rules.
  2. All forwarded packets are sent to the DOCKER-ISOLATION-STAGE-1 chain. This one is a bit more complex, so I’m going to wave my hands and say that all the packets I sent survived this rule and are RETURNed for further processing.
  3. Any packets forwarded from any interface to the docker0 interface are accepted if the connection state is RELATED or ESTABLISHED.
  4. Any packets forwarded from any interface to the docker0 interface are directed to the DOCKER chain. More on this in a minute, but our connection should be ACCEPTed here.
  5. Any packets from the docker0 interface to any other interface are accepted
  6. Any packets from the docker0 interface to the docker0 interface are accepted
  7. All other packets are REJECTed
  8. The DOCKER chain is only populated while the container is running, so if you run iptables while the container is stopped you may not see any rules here:

    $ sudo iptables -v -L DOCKER
    Chain DOCKER (1 references)
     pkts bytes target     prot opt in     out     source               destination 
        1    52 ACCEPT     tcp  --  !docker0 docker0  anywhere             ip-172-17-0-2.ec2.internal  tcp dpt:http

    This rule accepts TCP packets from interfaces other than docker0 destined for docker0 on destination port 80.

    Podman

    After launching the EC2 instance, I ran through the following steps to configure the host:

  • sudo yum update
  • sudo reboot
  • sudo yum install podman
  • sudo yum install iptables-services

Change the FORWARD chain policy to DROP in /etc/sysconfig/iptables:

:FORWARD DROP [0:0]

Restart iptables:

sudo systemctl restart iptables

I ran a simple container:

sudo podman run --rm -it --publish 8080:80 alpine sh

From inside the container, I started netcat listening on port 80:

# nc -l -p 80

I attempted to connect to the container from the outside world, e.g. my desktop:

curl 18.206.214.125:8080

However, the connection failed due to a timeout.

I attempted to connect to the container from its host:

curl 10.88.0.1:8080

This worked, and I see the request header appear in the container as expected:

GET / HTTP/1.1
User-Agent: curl/7.29.0
Host: 10.88.0.1:8080
Accept: */*

Why wasn’t the connection completing from my desktop? I suspected that something wasn’t routing between the interfaces correctly.

In the routing table, note that the CNI (Container Networking Interface) used by Podman uses a different default range of RFC 1918 IP addresses (10.88.0.0/16 instead of Docker’s 172.17.0.0/16):

$ route
Kernel IP routing table
Destination     Gateway         Genmask         Flags Metric Ref    Use Iface
default         ip-172-31-80-1. 0.0.0.0         UG    0      0        0 eth0
10.88.0.0       0.0.0.0         255.255.0.0     U     0      0        0 cni0
link-local      0.0.0.0         255.255.0.0     U     1002   0        0 eth0
172.31.80.0     0.0.0.0         255.255.240.0   U     0      0        0 eth0

I looked at the iptables FORWARD chain, where is was clear that all forwarded packets first jump to the CNI-FORWARD chain:

$ sudo iptables -v -L FORWARD
Chain FORWARD (policy DROP 0 packets, 0 bytes)
 pkts bytes target     prot opt in     out     source               destination 
    4   212 CNI-FORWARD  all  --  any    any     anywhere             anywhere             /* CNI firewall plugin rules */
    4   212 REJECT     all  --  any    any     anywhere             anywhere             reject-with icmp-host-prohibited

Next I looked at the iptables CNI-FORWARD chain:

$ sudo iptables -v -n -L CNI-FORWARD
Chain CNI-FORWARD (1 references)
 pkts bytes target     prot opt in     out     source               destination 
    4   212 CNI-ADMIN  all  --  *      *       0.0.0.0/0            0.0.0.0/0            /* CNI firewall plugin rules */
    0     0 ACCEPT     all  --  *      *       0.0.0.0/0            10.88.0.11           ctstate RELATED,ESTABLISHED
    0     0 ACCEPT     all  --  *      *       10.88.0.11           0.0.0.0/0</pre>

<ol>
<li>The CNI-FORWARD chain first jumps to the CNI-ADMIN chain, which in this case was empty.</li>
<li>Next it ACCEPTs any packets from RELATED or ESTABLISHED connections destined for the container IP address.</li>
<li>Next it ACCEPTS any packets from the container to any destination</li>
</ol>

If none of those rules match, it returns to the FORWARD chain where it hits the REJECT rule. What's missing is a rule that allows NEW connection packets destined for the container. There are a variety of ways to do this. At first I tried adding an overly broad rule directly to the FORWARD chain:

<pre><code>sudo iptables -I FORWARD -p tcp ! -i cni0 -o cni0 -j ACCEPT

That rule ACCEPTs any TCP packets from an interface other than cni0 bound for cni0. And it worked: after added that rule I was able to reach the container from my desktop via port 8080. However, that rule allows much more than was Docker allows. I removed that rule and added a more specific rule to the CNI-FORWARD chain:

sudo iptables -I CNI-FORWARD -p tcp ! -i cni0 -o cni0 -d 10.88.0.11 --dport 80 -j ACCEPT

That also worked, and much more closely resembled what Docker added to iptables.

Why doesn’t Podman add the necessary iptables rule automatically?

Good question. I’m using the podman package provided via yum from the CentOS extras repository, which provides podman version 0.11.1.1. It may be that future releases will address this. It may also be the case that Podman does not anticipate a default DROP policy on the FORWARD chain (although default DROP is best practice).

In any case, it is useful to know a little bit more about how container tools use iptables. It is also important to note that, at least at this point, Docker is easier to use than Podman.

Using Docker to get root access

$
0
0

In my previous post I mentioned that I am learning about Podman, a tool for running containers that does not require a daemon process (like the Docker daemon) or root privileges.

In this post I would like to demonstrate why running containers with root privileges could be dangerous.

Setup

For my demonstration, I have a CentOS 7 host running on VirtualBox. I have installed Docker and started the Docker daemon via the following steps:

sudo yum-config-manager --add-repo https://download.docker.com/linux/centos/docker-ce.repo
sudo yum install docker-ce
sudo systemctl start docker

Next, I will create a new user, Bob Billiards:

sudo useradd -u 8888 -c "Bob Billiards" bbilliar

I will let Bob run the docker command via sudo:

sudo visudo -f /etc/sudoers.d/docker
bbilliar     ALL=/usr/bin/docker

Test 1 – Confirm user is able to run Docker via sudo

[bbilliar@centos7 ~]$ sudo docker run --rm -it alpine sh
/ #

Bob is able to run Docker via sudo, as expected.

Test 2 – Publish a privileged port

This time, Bob is going to publish port 80, a privileged port. This may be unexpected, but Docker runs with root privileges:

[bbilliar@centos7 ~]$ sudo docker run --rm -it -p 80:80 alpine sh
/ #

To test that it is really bound to port 80, I started netcat listening on port 80 in the container:

/ # nc -l -p 80

Then I ran curl from the host:

[bbilliar@centos7 ~]$ curl localhost

The request headers appeared in the container, as expected:

GET / HTTP/1.1
User-Agent: curl/7.29.0
Host: localhost
Accept: */*

Test 3 – Share a volume and gain root access

This time, Bob is going to share volumes between the host and the container, specifically he is going to mount the host’s /etc/passwd file as /etc/passwd inside the container:

[bbilliar@centos7 ~]$ sudo docker run --rm -it --volume /etc/passwd:/etc/passwd alpine sh
/ # 

From here, edit /etc/passwd and change user bbilliar‘s uid and gid to 0.

Exit the container.

View user bbilliar’s /etc/passwd entry on the host:

[bbilliar@centos7 ~]$ grep bbilliar /etc/passwd
bbilliar:x:0:0::/home/bbilliar:/bin/bash

Logout, and log back in as bbilliar:

Using username "bbilliar".
bbillar@127.0.0.1's password:
Last login: Mon Dec 31 13:38:57 2018 from 10.0.2.2
[root@centos7 ~]#

Bob is now root! This may not be what the administrator expected when giving Bob sudo privileges to run Docker.

cp, mv, ownership and attributes

$
0
0

I had always been under the impressions that when moving a file from one Linux filesystem to another (i.e. a new inode is created), that mv is essentially a cp command followed by an rm command.

That’s not quite correct. It is essentially a cp --archive command followed by an rm command.

The difference between moving a file and copying a file

Moving a file preserves the ownership and existing file attributes, including the SELinux file type context. In the example case below, you can see that moving a file keeps the owner (chris) and the SELinux context of the directory in which the file was created (user_home_t).

A copied file inherits the properties, including the SELinux type context, of its parent directory.

Here’s a demonstration of the difference:

Create and move a file

$ touch test
$ ls -lZ test
-rw-r-----. chris chris unconfined_u:object_r:user_home_t:s0 test

$ sudo mv test /usr/local/bin/
$ ls -lZ /usr/local/bin/test 
-rw-r-----. chris chris unconfined_u:object_r:user_home_t:s0 /usr/local/bin/test

$ sudo rm /usr/local/bin/test

Create and copy a file

$ touch test
$ ls -lZ test
-rw-r-----. chris chris unconfined_u:object_r:user_home_t:s0 test

$ sudo cp test /usr/local/bin/
$ ls -lZ /usr/local/bin/test 
-rw-r-----. root root unconfined_u:object_r:bin_t:s0   /usr/local/bin/test

The copy of the file has a new owner, and a new SELinux context. Note there is an option (mv -Z) to reset the SELinux context when moving a file, but it would still maintain the original owner/group.

What does the documentation say?

man cp and man mv both directed me to the coreutils documentation for the complete manual. Some of the more relevant excerpts I have included below:

It first uses some of the same code that’s used by ‘cp -a’ to copy the requested directories and files, then (assuming the copy succeeded) it removes the originals.

(From info coreutils 'mv invocation')

‘mv’ always tries to copy extended attributes (xattr), which may include SELinux context, ACLs or Capabilities. Upon failure all but ‘Operation not supported’ warnings are output.

(From info coreutils 'mv invocation')

So what is cp -a?

‘-a’
‘–archive’
Preserve as much as possible of the structure and attributes of the original files in the copy (but do not attempt to preserve internal directory structure; i.e., ‘ls -U’ may list the entries in a copied directory in a different order). Try to preserve SELinux security context and extended attributes (xattr), but ignore any failure to do that and print no corresponding diagnostic. Equivalent to ‘-dR –preserve=all’ with the reduced diagnostics.

(From info coreutils 'cp invocation')

Which leads us to --preserve=all:

‘-p’
”–preserve'[=ATTRIBUTE_LIST]’
Preserve the specified attributes of the original files. If specified, the ATTRIBUTE_LIST must be a comma-separated list of one or more of the following strings:

(From info coreutils 'cp invocation')

Those attributes include, among others, ownership, context (SELinux context), and all.

Summary
A mv command, across filesystems, is still essentially a cp command followed by an rm command, but with --archive flag specified for the cp command. If you encounter unexpected problems after moving a file, double-check the file’s ownership, attributes, and SELinux context.

Linux policy based routing

$
0
0

Problem: I have a host that has 2 active network interfaces. One is used as a management port (eth0), one is used as an FTP dropbox (eth1).

Both can route to the Internet, but all connections other than FTP on eth1 are blocked via iptables. The default route uses the interface for the FTP dropbox, but I have a static route configured for the subnet that includes my management and monitoring hosts so that I can SSH to the host and check on host availability, disk space, mail queue, etc.

However, the static route means that I cannot monitor the FTP dropbox, since FTP connection attempts coming in on one interface and IP address are then routed out via the management interface and IP address.

Solution: Use policy-based routing to direct the system to consult a different routing table for connections coming in on the FTP interface.

It sounds easy enough.

From man ip-rule:

In some circumstances we want to route packets differently depending not only on destination addresses, but also on other packet fields: source address, IP protocol, transport protocol ports or even packet payload. This task is called ‘policy routing’.

It turns out, policy routing capabilities are quite flexible, but the implementation details are a little complex. Here are the steps I took to make sure that packets associated with inbound connections on eth1 also went out via eth1.

First of all, a few details:

  • IPv4 address of monitoring host: 192.168.200.44
  • IPv4 address of FTP interface: 192.168.100.9
  • IPv4 address of gateway in the subnet containing the FTP interface: 192.168.100.1

Step 1: Mark packets and connections coming in on eth1

For this, I used the iptables MARK and CONNMARK targets (see man iptables-extensions).

sudo iptables -A PREROUTING -t mangle -i eth1 -j MARK --set-mark 1
sudo iptables -A PREROUTING -t mangle -i eth1 -j CONNMARK --save-mark
sudo iptables -A OUTPUT -t mangle -j CONNMARK --restore-mark
  1. The first line sets a 32-bit mark on packets incoming on interface eth1. (I have also seen this mark referred to as fwmark, nfmark, and Netfilter mark.)
  2. The second line copies the packet mark to the connection mark for packets incoming on interface eth1. Since iptables tracks connection state, outbound replies to inbound packets will be treated as part of the same connection. You can view the iptables connection state via /proc/net/nf_conntrack.
  3. The third line copies the connection mark to the packet mark for all outbound packets.

This is important, because the packets we are interested in routing are outbound packets.

Step 2: Create a table in the Routing Policy Database (RPDB)

By default, there are 3 tables in the database: local, main, and default. You can confirm this by running ip rule show:

$ ip rule show
0:	from all lookup local
32766:	from all lookup main
32767:	from all lookup default

You can add your own label by editing /etc/iproute2/rt_tables. I added the following line:

100	eth1_table

The label is required, but is otherwise for convenience and does not need to refer to the interface. The entry in rt_tables is needed for the next step.

Step 3: Add a rule to the RPDB

sudo ip rule add priority 1000 fwmark 0x1 table eth1_table

The priority is an arbitrary between 0 and 32766, exclusive. The lowest priority value has the highest priority, so after this change you can confirm that the new rule will be evaluated after the local lookup, but before the main and default lookups:

$ ip rule show
0:	from all lookup local
1000:	from all fwmark 0x1 lookup eth1_table
32766:	from all lookup main
32767:	from all lookup default

The new rule indicates that packets with a mark value of 1 should consult the eth1_table routing table.

Step 4: Add a route to the routing table

sudo ip route add table eth1_table 0.0.0.0/0 via 192.168.100.1 dev eth1 src 192.168.100.9

After you add this route, you may expect to see it when you run ip route show. However, the main table is displayed by default if you do not specify a table. Instead, use this:

$ ip route show table eth1_table
default via 192.168.100.1 dev eth1 src 192.168.100.9

Step 5: update kernel parameter net.ipv4.conf.eth1.src_valid_mark

To make this change persistent, I created /etc/sysctl.d/10-eth1.conf containing the following line:

net.ipv4.conf.eth1.src_valid_mark=1

Be sure to adjust the permissions as needed, e.g.:

$ chmod 0644 /etc/sysctl.d/10-eth1.conf
$ chown root:root /etc/sysctl.d/10-eth1.conf

To load the new value immediately without rebooting:

sudo sysctl -p /etc/sysctl.d/10-eth1.conf

Once that change was made, my monitoring host was successfully able to receive ping replies from and establish FTP connections to the IPv4 address of the host.


Blocking WordPress scanners with fail2ban

$
0
0

My web logs are filled with requests for /wp-login.php and /xmlrpc.php, even on sites that aren’t running WordPress. Every one of these attempts is from a scanner trying to find, and possibly exploit, WordPress sites.

Why not put those scanners in a fail2ban jail and block them from further communication with your web server?

Fortunately, someone else had already done most of the work here:
Using Fail2ban on wordpress wp-login.php and xmlrpc.php

I made a few changes to the suggested filter. For example, on this site (osric.com) there is no /wp-login.php, but there are other instances of wp-login.php in subdirectories. Additionally, I am seeing primarily spurious GET requests in my access logs. I modified filter.d/wordpress.conf to look for both GET and POST requests for these WordPress-related files at the site root:

[Definition]
failregex = ^<HOST> .* "(GET|POST) /wp-login.php
            ^<HOST> .* "(GET|POST) /xmlrpc.php

I also made a couple modifications to jail.d/wordpress.conf:

[wordpress]
enabled = true
port = http,https
filter = wordpress
action = iptables-multiport[name=wordpress, port="http,https", protocol=tcp]
logpath = /var/log/custom/log/path/osric.com.access.log
maxretry = 1
bantime = 3600
  1. I set maxretry to 1 so that IP addresses will be banned after the first bad request.
  2. I removed findtime = 600 because that’s the default setting in fail2ban’s jail options.
  3. I increased the bantime from the default (10 minutes) to 1 hour (3600 seconds).

The other change I made was to add /wp-login.php and /xmlrpc.php to my robots.txt file:

User-agent: *
Disallow: /wp-login.php
Disallow: /xmlrpc.php

If a malicious user creates a hyperlink to osric.com/wp-login.php, well-behaved robots should avoid it. This way I’m not inadvertently banning Googlebot, for example.

It feels really good to slam the door in the face of these scanners! But unfortunately I have to ask…

Does this do any good?

I analyzed some of the server logs from before I implemented this block, and as it turns out, most of these are drive-by scanners: they are checking for the presence of a potentially vulnerable page, logging it, and moving on. They are basically gathering reconnaissance for future use.

If a host makes a couple GET or POST requests in the span of one second and then leaves, banning the host’s IP won’t be very effective.

Also, I know that fail2ban is useful for brute-force ssh attempts, but how useful is it for scanners requesting WordPress files? According to my fail2ban logs, over the month of July, 2019:

  • sshd: 69,771 IPs banned
  • WordPress: 4,538‬ IPs banned

wp-login.php isn’t quite the target I thought it was. That is, not compared to sshd.

In any case, it still feels good to block a questionable scanner. Running the following command and viewing the IP addresses that are currently in jail is satisfying:

sudo iptables -v -L f2b-wordpress

7 blocked right now! Take that, suspect IP addresses!

What else can we do to block or prevent WordPress scanners?

A few ideas, none of them earth-shattering:

  • As mentioned in a previous post (Using blocklist.de with fail2ban), the scanner IPs could be shared with a service like blocklist.de
  • Instead of blocking the IP, I could deliver a large file via a slow, throttled connection. This would slow down the scan, but not by much. (One of my colleagues informed me that this practice is called tarpitting.)
  • I could deliver a fake WordPress login form so that the scanners would accumulate unreliable data. Again, this might slow them down, but not by much.

If you have other ideas (even if they aren’t very good!) let me know in the comments.

Thanks

I would like to thank @kentcdodds for inspiring me to dust off this blog post (out of my many unpublished drafts) with his tweet:

Go ahead. Visit https://kentcdodds.com/wp-login.php. I think you’ll enjoy it.

Python, tuples, sequences, and parameterized SQL queries

$
0
0

I recently developed a teaching tool using the Python Flask framework to demonstrate SQL injection and XSS (cross-site scripting) vulnerabilities and how to remediate them.

The remediation step for SQL injection tripped me up though when I received the following error message:

sqlite3.ProgrammingError: Incorrect number of bindings supplied. The current statement uses 1, and there are 4 supplied.

The code that was being executed was:

cursor.execute("INSERT INTO query VALUES (NULL, ?)", (query_text))

(The value of query_text submitted was ‘test’.)

This looks very similar to the example in the documentation for sqlite3.Cursor.execute(), but the key difference here is that my query had one parameterized value instead of 2 or more.

Why does that make a difference? Because a tuple containing a single value must be followed by a trailing comma. (See the documentation for the tuple data type in Python.)

Without the trailing comma, ('test') becomes the string 'test'. Strings are a particular type of Python sequence, a sequence of characters. This is why the error message indicated that 4 bindings were supplied: the bindings were 't', 'e', 's', and 't'.

The solution, therefore, was to add a comma to the existing code:

cursor.execute("INSERT INTO query VALUES (NULL, ?)", (query_text,))

At first I thought the documentation could be improved. If parameters in the qmark format can take any sequence type, shouldn’t it state that explicitly? For example, using a Python list instead would solve this problem, since a list can contain a single item without the need for a trailing comma:

[query_text]

However, it doesn’t make sense to use a Python list to send parameters to a SQL query, because Python lists are mutable. A list can be sorted, which could change the order of your parameters. A list can have items appended and removed, which would change the number of parameters. A tuple, on the other hand, is immutable: it will have the same number of items in the same order as when it was defined. Therefore, it is the preferred sequence data type to use to send parameter values to a SQL statement.

The trailing comma needed by a tuple containing a single item is somewhat unfortunate, as the Python tutorial on the tuple data type admits:

A special problem is the construction of tuples containing 0 or 1 items: the syntax has some extra quirks to accommodate these. Empty tuples are constructed by an empty pair of parentheses; a tuple with one item is constructed by following a value with a comma (it is not sufficient to enclose a single value in parentheses). Ugly, but effective.
[Emphasis added]

This is something that regular Python programmers get used to, but for a beginner or casual user will likely cause some confusion.

Python Flask, escaping HTML strings, and the Markup class

$
0
0

As in the previous post, I had created a simple web app using Python Flask to use as a teaching tool. The purpose was to demonstrate SQL injection and XSS (cross-site scripting) vulnerabilities and how to remediate them.

In this case, the remediation step for XSS (escaping output) tripped me up. I tried this:

return '<p>You searched for: ' + escape(user_input) + '</p>'

I expected it to escape only the user_input variable, but instead it escaped all the HTML, returning this:

&lt;p&gt;You searched for: &lt;script&gt;alert(1)&lt;/script&gt;&lt;/p&gt;


(Just want possible solutions? Scroll to the bottom. Otherwise, on to the….)

Details

The reason for this is that Flask.escape() returns a Markup object, not a string.

Both Markup and escape are imported into Flask from Jinja2:

from jinja2 import escape
from jinja2 import Markup

Which in turn comes from the module Markupsafe.

Markup is a subclass of text_type (which is essentially either str or unicode, depending on whether you are using Python2 or Python3).

The Markup class contains __add__ and __radd__ methods that handle the behavior when we apply arithmetic operators (see Emulating numeric types). In this case, those methods check to see if the other operand is compatible with strings, and if so, converts it to an escaped Markup object as well:

def __add__(self, other):
    if isinstance(other, string_types) or hasattr(other, "__html__"):
        return self.__class__(super(Markup, self).__add__(self.escape(other)))
    return NotImplemented

def __radd__(self, other):
    if hasattr(other, "__html__") or isinstance(other, string_types):
        return self.escape(other).__add__(self)
    return NotImplemented

(From the source code at src/markupsafe/__init__.py)

Surprising Results?

At first that seemed to me to violate the Principle Of Least Astonishment. But I realized I didn’t know what Python would do if I created a subclass of str and added a plain-old string to an object of my custom subclass. I decided to try it:

>>> import collections
>>> class MyStringType(collections.UserString):
...     pass
... 
>>> my_string1 = MyStringType("my test string")
>>> string1 = "plain-old string"
>>> cat_string1 = my_string1 + string1
>>> cat_string1
'my test stringplain-old string'
>>> type(my_string1)
<class '__main__.MyString'>
>>> type(string1)
<class 'str'>
>>> type(cat_string1)
<class '__main__.MyString'>

Interesting, the result of adding an object of a subclass of string and a plain-old string is an object of the subclass! It turns out, the collections.UserString object implements __add___ and __radd__ methods similar to what we saw in Markup:

def __add__(self, other):
    if isinstance(other, UserString):
        return self.__class__(self.data + other.data)
    elif isinstance(other, str):
        return self.__class__(self.data + other)
    return self.__class__(self.data + str(other))
def __radd__(self, other):
    if isinstance(other, str):
        return self.__class__(other + self.data)
    return self.__class__(str(other) + self.data)

(From the source code at cpython/Lib/collections/__init__.py)

Solutions

There are several different ways to combine the escaped string (a Markup object) and a string without converting the result to a Markup object. The following is by no means an exhaustive list:

Solution 1: str.format

>>> from flask import escape
>>> user_input = '<script>alert(1);</script>'
>>> html_output = '<p>You searched for: {}</p>'.format(escape(user_input))
>>> html_output
'<p>You searched for: &lt;script&gt;alert(1);&lt;/script&gt;</p>'

Solution 2: printf-style string formatting

>>> from flask import escape
>>> user_input = '<script>alert(1);</script>'
>>> html_output = '<p>You searched for: %s</p>' % escape(user_input)
>>> html_output
'<p>You searched for: &lt;script&gt;alert(1);&lt;/script&gt;</p>'

Solution 3: cast the Markup object to a str object:

>>> from flask import escape
>>> user_input = '<script>alert(1);</script>'
>>> html_output = '<p>You searched for: ' + str(escape(user_input)) + '</p>'
>>> html_output
'<p>You searched for: &lt;script&gt;alert(1);&lt;/script&gt;</p>'

Solution 4: Create a Markup object for the trusted HTML:

>>> from flask import escape, Markup
>>> user_input = '<script>alert(1);</script>'
>>> html_output = Markup('<p>You searched for: ') + escape(user_input) + Markup('</p>')
>>> html_output
Markup('<p>You searched for: &lt;script&gt;alert(1);&lt;/script&gt;</p>')

(A Markup object by default trusts the text passed to it on instantiation and does not escape it.)

A more likely solution, in practice, would be to use Jinja2 templates. Although Jinja2 templates do not automatically escape user input, they are configured to do so by Flask:

Flask configures Jinja2 to automatically escape all values unless explicitly told otherwise. This should rule out all XSS problems caused in templates….

(from Security Considerations — Flask Documentation (1.1.x): Cross-Site Scripting)

Running Joomla on Docker

$
0
0

I was looking for a well-known CMS (Content Management System) that I could easily run in a Docker container as a target for information security reconnaissance tools, such as WhatWeb.

I found an official Docker image for Joomla, a CMS that I had used previously some years ago: https://hub.docker.com/_/joomla

Using a backend MySQL database on localhost

I had some problems running it at first. I tried to set up a local MariaDB/MySQL database and have the Joomla container communicate directly with the underlying host:

docker run --name some-joomla -e JOOMLA_DB_HOST=localhost:3306 -e JOOMLA_DB_USER=joomla -e JOOMLA_DB_PASSWORD=joomP455 -d joomla

That didn’t work. The Joomla container crashed shortly after starting. When I looked at the container logs using the following command:

docker logs some-joomla

I found the same error message repeated several times:

Warning: mysqli::__construct(): (HY000/1045): Access denied for user 'joomla'@'localhost' (using password: YES) in /makedb.php on line 20

Of course! Within the context of the container, localhost means the container itself!

I was able to get this to work by specifying --network=host. (See Use Host Networking in the Docker documentation.)

Here was the command I used (after creating a joomla database and joomla database user):

docker run --name some-joomla -e JOOMLA_DB_HOST=127.0.0.1 -e JOOMLA_DB_USER=joomla -e JOOMLA_DB_PASSWORD=joomP455 -e JOOMLA_DB_NAME=joomla --network host -d joomla

Using a Dockerized MySQL database as the backend

That was great progress! But since this was just for a temporary demo, I found an even easier way: using a MySQL Docker container as the backend database: https://hub.docker.com/_/mysql

This is what I tried the first time:

docker run --name some-mysql -e MYSQL_ROOT_PASSWORD=passW0rd -e MYSQL_DATABASE=joomla -e MYSQL_USER=joomla -e MYSQL_PASSWORD=joomP455 -d mysql:latest

That didn’t work, though. When I started the Joomla container using the following command:

docker run --name some-joomla --link some-mysql:mysql -p 8080:80 -d joomla:latest

The container would soon stop. I looked at the logs using docker logs some-joomla and found the same error message repeated numerous times:

Warning: mysqli::__construct(): The server requested authentication method unknown to the client [caching_sha2_password] in /makedb.php on line 20

I searched for that error message, and found a GitHub issue for another project that suggested downgrading MySQL (https://github.com/laradock/laradock/issues/1390).

docker run --name some-mysql -e MYSQL_ROOT_PASSWORD=passW0rd -e MYSQL_DATABASE=joomla -e MYSQL_USER=joomla -e MYSQL_PASSWORD=joomP455 -d mysql:5

docker run --name some-joomla --link some-mysql:mysql -p 8080:80 -d joomla:latest

It worked! I was able to access the Joomla setup on http://localhost:8080

However, I ran into an error on step 2 of the web-based Joomla setup (configuring the database):

Error
Could not connect to the database. Connector returned number: Could not connect to MySQL server.

I turns out, I had specified localhost as the database host, as suggested. This is, of course, the same problem I had before: localhost, on the container, is the container itself! I used the following command:

docker inspect some-mysql

From that output I discovered that the some-mysql container’s IP address was 172.17.0.2, which was reachable from the other container.

Unless your Docker installation is substantially different, if you start the some-mysql container followed by the some-joomla container, you can likely used the same IP address I did. (In my case, the some-joomla container’s IP address was the next sequential address: 172.17.0.3.)

Scanning the Joomla container

Now I had a running Joomla instance that I could target using WhatWeb and other scanners:

# whatweb -a 4 localhost:8080

http://localhost:8080 [200 OK] Apache[2.4.38], Cookies[e6b39c2ef305d5fa34c3ba66a227b8de], HTML5, HTTPServer[Debian Linux][Apache/2.4.38 (Debian)], HttpOnly[e6b39c2ef305d5fa34c3ba66a227b8de], IP[::1], JQuery, MetaGenerator[Joomla! - Open Source Content Management], OpenSearch[http://localhost:8080/index.php/component/search/?layout=blog&amp;id=9&amp;Itemid=101&amp;format=opensearch], PHP[7.2.23], Script, Title[Home], X-Powered-By[PHP/7.2.23]

Running WordPress on Docker

$
0
0

Similar to the previous post, Running Joomla on Docker, I was interested in spinning up a temporary WordPress installation so that I could target it with various scanning and reconnaissance tools. There is an official WordPress Docker image at https://hub.docker.com/_/wordpress/.

The steps were more-or-less the same. Note that if you followed the steps in the previous post, you will likely want to stop and remove the existing MySQL container before attempting to start a new one with the same name:

docker stop some-mysql
docker rm some-mysql

Start the MySQL Docker container:

docker run --name some-mysql -e MYSQL_ROOT_PASSWORD=passW0rd -e MYSQL_DATABASE=wordpress -e MYSQL_USER=wordpress -e MYSQL_PASSWORD=wpP455 -d mysql:5

Start the WordPress Docker container:

docker run --name some-wordpress --link some-mysql:mysql -e WORDPRESS_DB_HOST=172.17.0.2 -e WORDPRESS_DB_USER=wordpress -e WORDPRESS_DB_PASSWORD=wpP455 -e WORDPRESS_DB_NAME=wordpress -p 8080:80 -d wordpress

I was then able to visit http://localhost:8080 and complete the web-based setup tasks.

Note that the MySQL container, as launched, does not have any shared volumes. Everything stored there is ephemeral and will be lost if the container is removed. To my surprise, however, the content survived stopping and restarting the container. The volumes for each container are located in the following directory:

/var/lib/docker/volumes/

Using docker inspect some-wordpress I could see that there was a mounted volume at:

/var/lib/docker/volumes/be3d54591da609e911a1ec3f0615a564990b37da184a67fab0ac0e75cc711c7f/_data

Indeed, the usual WordPress files, such as wp-config.php, were located there.

I did the same for the MySQL container and found the .frm and .ibd files for each of the tables in the WordPress database.

These files persist when the container is stopped, and persist even when the container is removed! In fact, when I removed all containers, I discovered there were still 22 volumes in /var/lib/docker/volumes from previous container projects and experiments.

The command to view these volumes is:

docker volume ls

To remove unused volumes, use:

docker volume prune

Container volumes are not as ephemeral as I originally thought!

Viewing all 144 articles
Browse latest View live